Why energy is now a performance constraint, not a side issue
You feel it when a model that looked fine in a demo turns expensive in production: GPUs sit near max utilization, latency spikes during traffic peaks, and the cloud bill climbs even though “nothing changed.” Energy isn’t just a sustainability line item anymore; it’s tied directly to throughput, tail latency, and how many users you can serve per dollar.
Power and cooling limits cap how much hardware you can practically run, especially in shared clusters. Higher energy use also brings hidden costs: stricter rate limits, longer job queues, and fewer training iterations when budgets tighten. Treating energy like a first-class performance metric makes the trade-offs visible early, before they become outages or surprise invoices.
Measure what matters: set baselines for energy, latency, and quality
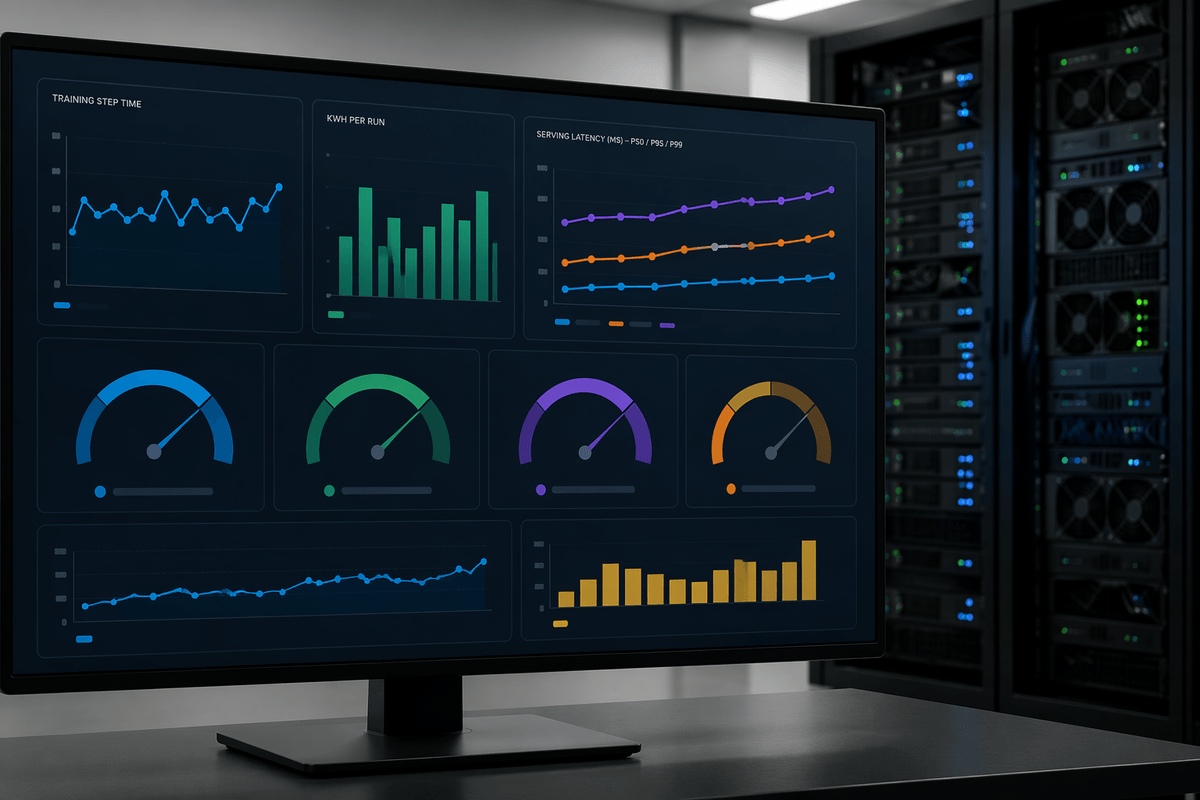
A familiar failure mode is “optimizing” something you didn’t measure: you shave 20% off GPU time, then discover p95 latency got worse because you increased batching, or quality regressed on the edge cases that actually drive support tickets. Start by establishing a baseline for one representative workload per critical path: training step time and kWh per run, plus serving p50/p95/p99 latency, tokens/sec, and cost per 1,000 requests. If you can’t measure energy directly, use proxies you can trust (GPU power draw from telemetry, instance-hour cost, and utilization) and keep them consistent over time.
Pair those with a lightweight quality gate: offline evals that match your product (golden prompts, retrieval hit rate, task success), and a small online slice (conversion, CSAT, deflection). The practical constraint is instrumentation overhead and noise—logging more can raise latency and storage costs—so keep the first pass simple, repeatable, and hard to game.
Choose the smallest model that still meets your real requirements
You’ll often find you’re running a larger model than you need because the “safe” choice was to match a benchmark or a competitor. In practice, requirements are narrower: a set of intents, a writing style, a handful of tools, and a tolerance for occasional fallback. Start by ranking your requests into tiers (mission-critical, common, long-tail) and test a smaller candidate model on the same golden prompts and online slice you already instrumented. If quality is acceptable on the critical tier, you can route only the hard cases to the larger model and keep the rest on the cheaper path.
The smaller models can be more sensitive to prompt wording, may need better retrieval to stay factual, and can require more guardrails to avoid re-tries that erase savings. But when it works, model downsizing is the cleanest lever: fewer parameters usually means less energy per token, lower latency, and higher throughput without touching your infrastructure.
Cut compute without quality loss: quantization, distillation, and pruning
Model size isn't always the real bottleneck. Plenty of models fit comfortably on the target hardware yet still consume more memory bandwidth and compute than each request can justify. Compression techniques address that imbalance by reducing inference cost without changing what the product is expected to deliver.
Quantization is usually the first place to look because it offers meaningful gains with relatively little engineering effort. Lower-precision weights—and, in some cases, activations—reduce memory traffic and often improve throughput. Success, however, depends heavily on the deployment stack. Some runtimes and kernels have limited support for certain precision formats, and an overly aggressive quantization strategy may introduce subtle regressions that only appear in areas such as formatting, multilingual responses, or tool use. Reliable evaluation therefore depends on targeted workload-specific tests rather than a single aggregate benchmark.
Distillation becomes attractive when there's time for a more substantial optimization cycle. A smaller student model trained to imitate a larger teacher on representative production traffic often retains behavior far better than simply shrinking the architecture. The trade-off comes earlier in the process, requiring additional compute resources and carefully curated training data. Pruning has its place as well, but the benefits depend almost entirely on the inference runtime. Without efficient support for sparse execution, a pruned model may become more complicated to maintain while delivering little practical improvement in latency or cost.
Spend fewer tokens: prompts, retrieval, and caching patterns
You can often cut energy without touching the model by simply generating fewer tokens. The most common leak is “extra thinking” induced by prompts: long instructions repeated on every call, verbose formatting requirements, and retries caused by ambiguous constraints. Move stable policy text into a short system header, tighten output schemas (fixed fields, hard length caps), and prefer “answer then cite” over open-ended brainstorming when users don’t need it. Every prevented re-try is a double win: fewer tokens and less tail latency.
Retrieval is the other big lever. Good RAG reduces long context windows and lowers hallucination-driven back-and-forth, but it only works if you tune for precision: smaller top-k, chunking that matches your question types, and aggressive de-duplication. Cache at the highest level you can: embeddings, retrieval results for repeated queries, and final responses for deterministic requests. The constraint is freshness and privacy—caches need invalidation rules, tenant isolation, and a plan for “nearly identical” prompts where misses can erase savings.
Run the hardware efficiently: batching, precision, and right-sized infrastructure
Hardware efficiency usually becomes the limiting factor before GPU utilization does. Even when accelerators appear fully occupied, throughput may stop improving while p95 latency steadily increases during busy periods. Batching is the first place to look, but it should be configured around user experience rather than hardware alone. Dynamic batching with a tightly controlled maximum wait time—typically from a few milliseconds to a few dozen—can increase throughput without forcing interactive requests to sit in a queue. Sequence-length management matters just as much. Capping maximum context lengths and grouping requests of similar size prevents short prompts from being slowed by much longer ones.
Lower-precision inference offers another substantial improvement when the software stack supports it. Running models in FP16, BF16, or, where appropriate, INT8 or FP8 reduces memory bandwidth requirements and increases the amount of work each GPU can handle simultaneously. Stability still needs careful validation, since issues sometimes surface in unexpected ways, such as malformed tool calls or formatting inconsistencies rather than obvious accuracy drops.
Infrastructure choices deserve the same attention. GPU memory should match the context windows your workloads actually use, avoiding oversized instances that spend much of their capacity idle. Background jobs and lower-priority workloads are often good candidates for less expensive compute. These optimizations improve efficiency, but they also make systems more complex to debug and forecast, so the gains should be weighed against the added operational overhead.
Training smarter: fewer runs, better data, and early stopping signals

You’ve probably burned more energy on “extra training” than on any single inference tweak: repeated fine-tunes because a run drifted, a sweep that explored too wide a space, or a dataset refresh that quietly changed the task. Tighten the loop by shrinking the number of runs. Start from a strong baseline config, reuse it, and do small, bounded experiments (one variable at a time) instead of open-ended grids. Treat data as the highest-leverage knob: de-duplicate near-identical samples, downweight low-signal long texts, and oversample the failure cases that map to real user pain. Better data usually beats more steps.
Early stopping is the other practical win. Track a task-aligned validation set and stop when improvements flatten for a fixed patience window, not when you hit an arbitrary epoch count. Add cheap “canary” evals (format compliance, tool-call success, retrieval-grounded QA) every N steps so you catch regressions early. The small eval sets can mislead you, so keep them stable and versioned.
Put it into a practical plan: quick wins, guardrails, and rollout
A workable plan starts with the cheapest, lowest-risk changes: cap max output tokens, remove repeated prompt boilerplate, and add response/retrieval caching for common queries. Then take one “bigger” lever per cycle—downsize with routing, quantize, or introduce dynamic batching—and ship it behind a flag so you can roll back quickly if p95 latency or tool-call reliability drifts.
Set guardrails you can enforce: a golden-prompt suite, a small online holdout, and budgets for cost per 1,000 requests and energy per run. Expect some friction: instrumentation, cache invalidation, and kernel compatibility will cost engineering time. Roll out by traffic tier, watch tail latency and retry rates, and only then expand coverage.