What it really means when AI “detects hidden signals”
In a meeting, someone says the model “found a hidden signal,” and it can sound like the system uncovered a secret rule no one else could see. Usually it’s simpler: the model noticed a stable relationship between inputs and an outcome that wasn’t obvious from a few charts, a small sample, or human intuition. That “signal” might be a subtle combination of factors—timing, sequence, or context—that only becomes clear when you compare thousands or millions of examples.
Detection is not the same as understanding. Most models don’t discover causes; they discover correlations that help prediction on data like what they’ve seen. If purchase risk rises after a certain pattern of support tickets, the model can flag it without knowing why it happens. That’s useful for prioritization, but it’s also where mistakes start: the pattern may rely on a proxy (like region or device type) that won’t hold up after a product change.
A practical way to interpret “hidden” is “hard to notice without aggregation.” It can mean weak signals spread across many variables, rare events buried in volume, or interactions humans don’t naturally test. These patterns can be fragile: data drift, small labeling errors, or a biased sampling process can turn an impressive “signal” into a confident false positive. The right reaction is curiosity plus verification, not immediate automation.
Signals vs noise: patterns worth acting on
You’ve probably seen a dashboard spike and wondered whether it’s real or just randomness. Models face the same problem at scale: most apparent “patterns” disappear when you look at a different week, a different cohort, or a slightly cleaner dataset. A signal is something that stays useful under small shocks—new data, minor product changes, or reasonable measurement error. Noise is anything that looks predictive only because the sample is small, the outcome is rare, or the data accidentally encodes the answer (like a post-event field leaking into training).
Patterns worth acting on usually have three traits: they repeat across time and segments, they improve decisions compared to a simple baseline, and they can be tested cheaply before rollout. The validation takes time, holdout data, and sometimes controlled experiments, and those costs can exceed the value of a “clever” model that mostly amplifies false alarms.
Where hidden signals usually live in real data
In most organizations, the “hidden” part is where the data is messy, indirect, or split across systems. Signals often show up in combinations of ordinary fields that only matter together: a price change plus a shipping delay plus a second support contact within 48 hours. They also live in sequences—what happened first, what followed, and how quickly—not just totals or averages.
Text and behavioral logs are common signal reservoirs because they capture intent and friction. Complaint wording, call notes, click paths, and “hesitation” patterns (repeated searches, back-and-forth navigation) can predict churn or fraud before a human would label it. These sources are high volume, inconsistently recorded, and sensitive. Cleaning, joining, and governing them usually costs more time than training the model.
Hidden signals also appear at boundaries: handoffs between teams, edge-case workflows, and rare but costly outcomes. That’s where you get sparse data, shifting definitions, and lots of false positives if you don’t pin down what “success” and “failure” actually mean.
How models surface signals: features, embeddings, and anomalies
Consider a churn model that gets better not because it “read minds,” but because it assembled the right inputs. In classic tabular ML, those inputs are features: counts, rates, time since last action, and “interaction” features like “ticket volume × recent delivery delay.” Many teams miss that a lot of the work is deciding what to represent, and at what time, so the model can’t accidentally learn from post-event data. That feature work is labor, and it’s easy to get wrong when definitions differ across systems.
For text, images, and clickstreams, models often rely on embeddings—compact numeric summaries that place similar items near each other. Instead of hand-coding “angry complaint,” an embedding can cluster similar phrasing and let the model learn which clusters predict outcomes. You may know a vector mattered without knowing which words or concepts drove it.
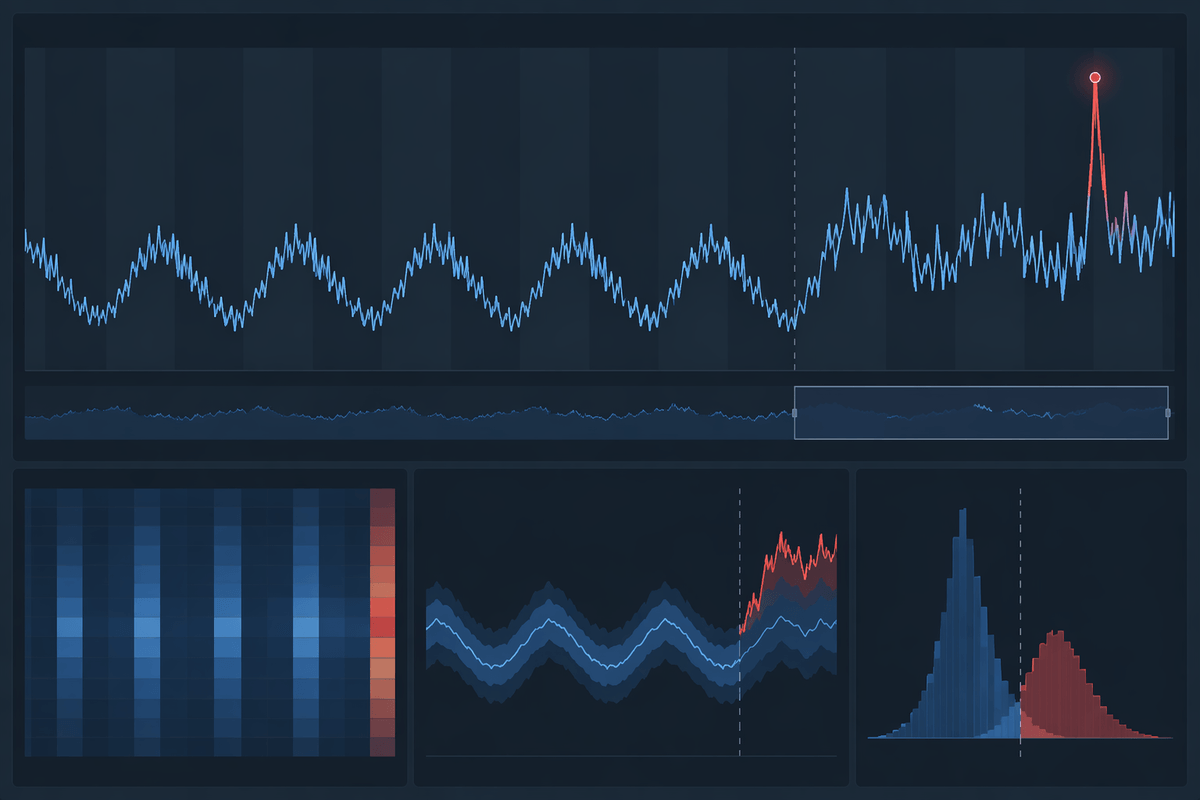
Anomaly detection is a different angle: it flags what looks unusual versus historical patterns, like a vendor whose refund rate shifts overnight. It can surface issues early, but it’s sensitive to seasonality and policy changes, so “anomalous” doesn’t automatically mean “bad.”
How to tell discovery from overfitting and coincidence
You’ve likely seen a model look brilliant in a notebook and fall apart the moment it meets a new month of traffic. Real discovery shows up when performance holds on data the model couldn’t have seen: a strict holdout set, a later time window, or a different region or customer segment. If the “signal” disappears when you move the evaluation forward in time, it was probably learning quirks of that period—promotions, outages, a policy change—not something stable.
Overfitting often hides behind impressive averages. Look for warning signs: big gains on rare outcomes but lots of false alarms, features that sound like the answer (“case closed reason”), or performance driven by one cohort. Stress-test by removing suspicious fields, simplifying the model, and checking calibration—whether “80% risk” actually means roughly 8 in 10 cases. Doing this well requires clean time-stamped data, careful splits, and enough volume to measure stability without fooling yourself.
Coincidence is easiest to spot when you ask what would change the prediction. If tiny input tweaks swing the result, or explanations vary wildly across similar cases, treat the pattern as brittle. The most useful question for decision-makers is operational: “If we act on this alert, what is the expected cost of being wrong, and can we verify cheaply before scaling?”
Common high-value use cases (and what success looks like)
A familiar moment: you get a weekly list of “high-risk” accounts, but the team still asks which ones to call first. High-value signal detection usually earns its keep where attention is scarce and outcomes are expensive. Churn prevention works when alerts arrive early enough to intervene and are specific enough to tailor outreach (for example, “delivery friction + repeat contacts” rather than a generic risk score). Success looks like lift over a simple rules baseline, measured on future cohorts, with outreach capacity and false-positive costs priced in.
Fraud and abuse detection is another strong fit because patterns shift and manual review can’t cover everything. A good system reduces losses while keeping review queues manageable, and it stays calibrated as tactics change. In operations, anomaly detection can surface broken integrations, pricing errors, or quality regressions before customers report them; success is faster time-to-detection with a low “alarm fatigue” rate.
Recommendation and search ranking can also surface subtle preference signals, but the bar is real-world behavior: higher conversion or retention without harming diversity or trust. These wins often require instrumentation, careful experimentation, and ongoing monitoring—costs that can outweigh small model gains.
Constraints you can’t ignore: data quality, bias, and privacy

You can’t validate a “hidden signal” if the underlying data is inconsistent. Missing timestamps, duplicated users, shifting definitions (“active,” “churned”), and labels recorded after the fact can create patterns that only reflect process artifacts. A common constraint is organizational, not technical: data lives in multiple systems with different owners, and the time to clean and align it can dwarf model training time.
Bias is often a signal the model shouldn’t use. If past decisions shaped the data—who got discounts, who was flagged for review—the model may learn to reinforce those outcomes through proxies like ZIP code, language, or device type. Privacy adds another hard limit: joining sensitive text, location, or support logs may trigger consent, retention, and access-control requirements. Sometimes the responsible choice is a smaller model on less data, with clearer governance and lower risk.
A practical path from “interesting pattern” to trusted decision
A useful pattern becomes a trusted decision when you treat it like a product change: define the action, the recipient, and the expected payoff before you scale. Start with a simple baseline and a “no-regrets” workflow (for example, add a review step or a low-cost outreach) so early mistakes don’t create expensive downstream effects. Log every alert, decision, and outcome so you can measure whether the model improved results versus the baseline, not just whether it looked accurate in isolation.
Move from validation to deployment with gates: time-based holdouts, cohort checks, calibration, and a clear threshold tied to operational capacity. Require a reason code or example-driven explanation that a reviewer can sanity-check, even if it’s imperfect. Plan for ongoing costs—monitoring drift, retraining, and privacy reviews—and set a kill switch. If you can’t explain what you’ll do when the model is wrong, it isn’t ready to drive decisions.