Why AI performance often bottlenecks on the network
A common surprise when scaling a model is that GPUs look “busy,” but step time barely improves when you add more of them. The limit is often the network: gradients, activations, and parameter shards have to move between devices, and that traffic grows quickly with model size and parallelism. All-reduce and all-to-all collectives can turn a fast compute kernel into a stop-and-wait pattern when bandwidth or latency is insufficient.
The same pattern shows up in inference. If your request fan-outs across multiple GPUs or nodes (tensor/pipe parallel, MoE routing, KV-cache offload), a few extra microseconds of hop latency can dominate p99. Even storage can become “network-shaped” when checkpoints, datasets, or feature stores sit behind shared links.
Because the network is shared infrastructure, you also inherit contention: other jobs, background replication, and noisy neighbors. Fixing it isn’t free—higher-radix switches, more NICs, or fatter links cost money, power, and operational complexity—so the practical question becomes where the bottleneck really is, and what trade-off you can afford.
The hidden cost of manual network design decisions
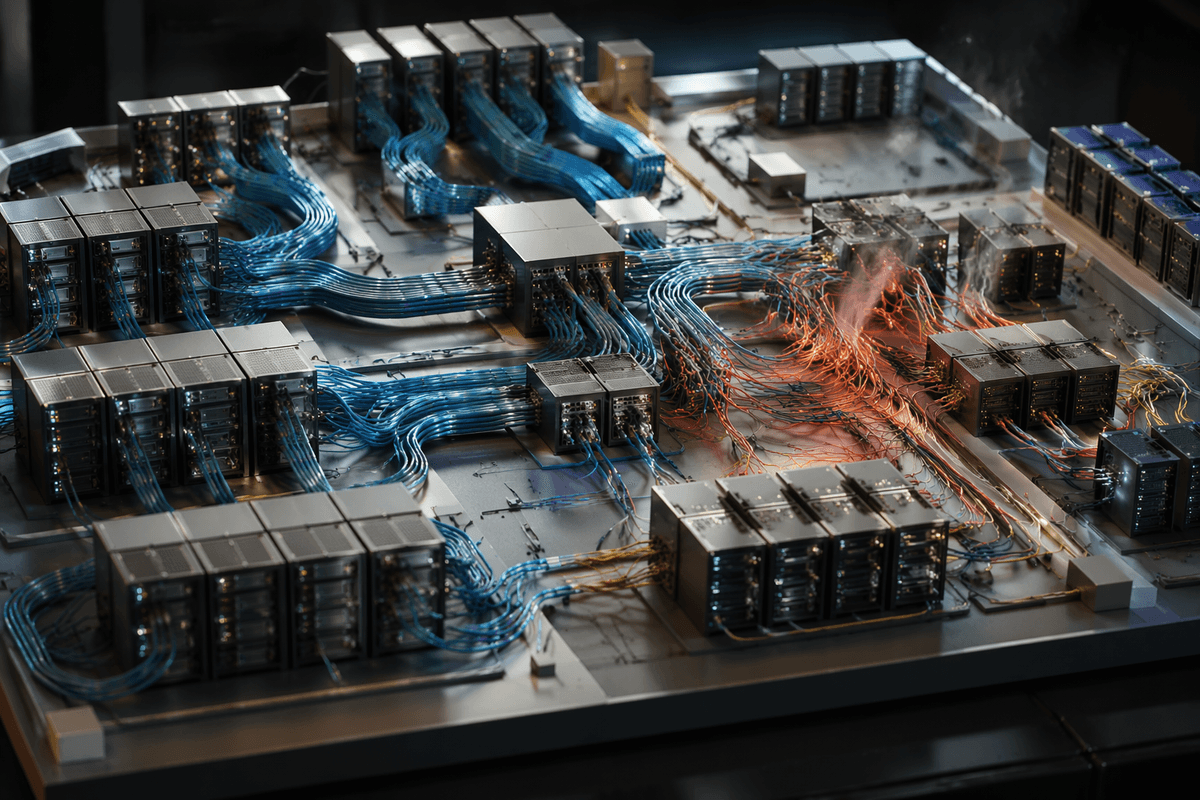
Manual network design tends to start with a reasonable default—pick a fabric, a link speed, a blocking ratio—and then patch over issues as they appear. The hidden cost is that each “small” choice quietly encodes assumptions about your parallelism strategy, message sizes, and job mix. If those assumptions shift (moving from data parallel to MoE, adding KV-cache offload, mixing training and latency-sensitive inference), the network can become overbuilt in the wrong places and underbuilt in the ones that matter.
Humans also optimize for what’s easiest to reason about: peak bandwidth on paper, a clean topology diagram, or symmetry across racks. Real workloads care about tail latency, collective patterns, and congestion during synchronized phases. You end up paying twice: once in capital and power for headroom you don’t use, and again in engineering time chasing regressions that only show up at scale. The practical constraint is that validating every permutation—topology, routing, placement, and schedule—requires experiments that are expensive to run and hard to reproduce.
What automated network design actually does in practice
On a real cluster, “automated network design” is less about drawing a prettier topology and more about turning your workload into constraints and objective functions. You feed it targets like: maximum step time for a specific training job, p99 latency for an inference service, budgeted oversubscription, allowed cable counts, and specific hardware (NIC speed, switch radix, GPU-to-NIC mapping). It then searches across a design space—topology (fat-tree, dragonfly, spine/leaf variants), link allocation, blocking ratios, routing policies, and sometimes placement rules for jobs and shards—using models or simulators rather than full-scale trial runs.
In practice, the efficiency gains usually come from reducing synchronized slowdowns: fewer congested hot spots during all-reduce, shorter average hop counts for all-to-all, and better isolation between traffic classes like checkpoints and interactive inference. The outputs are only as good as the inputs: if your collective patterns, message sizes, or job mix are wrong, the “optimal” fabric can be optimal for a workload you don’t actually run.
Matching topology to workload: training, inference, and storage
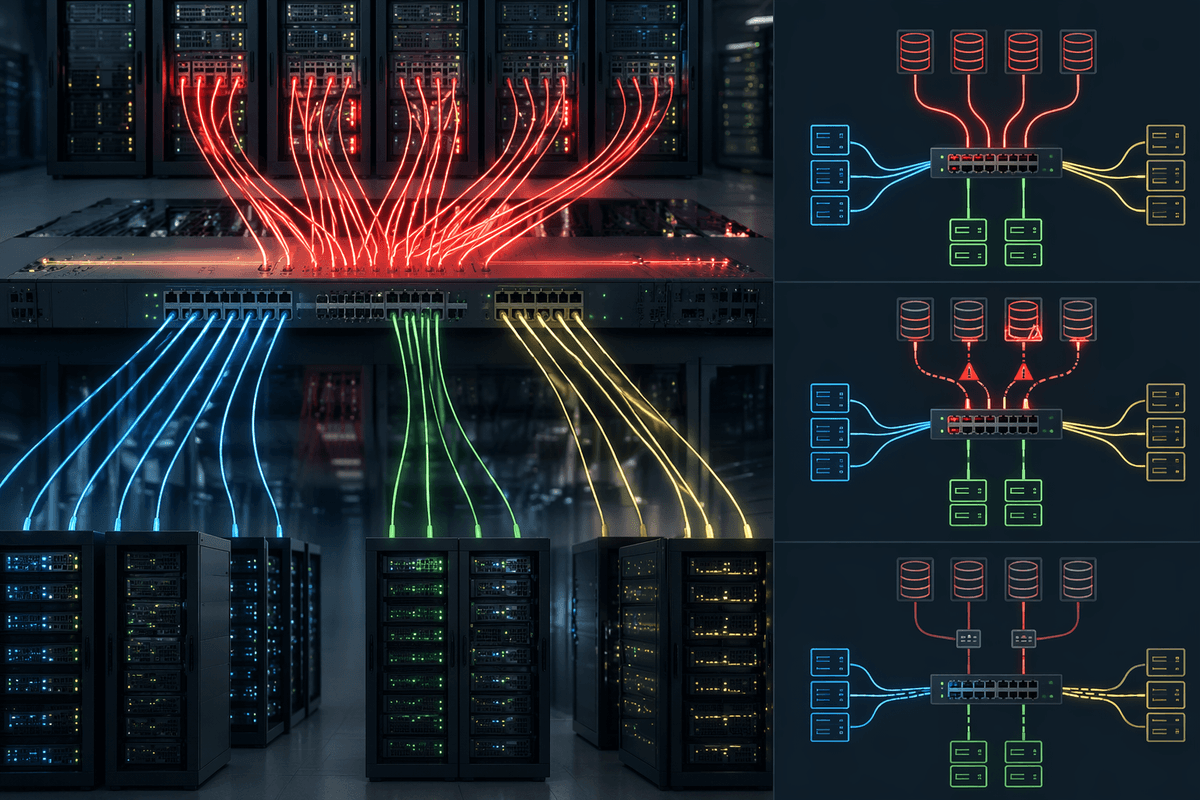
In training, the “right” topology is usually the one that makes synchronized phases predictable. Data-parallel all-reduce wants high bisection bandwidth and low congestion when many ranks communicate at once; large all-to-all (common with MoE and some sharding patterns) is more sensitive to hop count and path diversity. A fabric that looks fine on aggregate throughput can still stall steps if a few links become recurring hot spots at the same barrier point. That’s why automated design tends to optimize for step-time variance, not just average bandwidth.
Inference pushes different pressure points. Many services are latency-shaped: microbursts, small messages, and strict p95/p99 budgets. If requests fan out across devices, reducing per-hop latency and avoiding queue build-up often matters more than maximizing theoretical throughput. You may also want traffic-class isolation so training spikes or checkpoint writes don’t bleed into tail latency.
Storage and checkpointing are the quiet spoiler. They look “background,” but bursts can saturate shared uplinks and inject packet loss or ECN backoff into collectives. Separating paths, rate-limiting, or scheduling I/O windows helps, but costs ports, cables, and operational discipline—constraints automation can account for explicitly.
How automation finds better trade-offs than humans
You can usually spot the human approach in a design review: maximize link speed, keep the topology symmetric, and add “just enough” headroom to feel safe. Automation can do better because it treats the network like a constrained optimization problem with measurable outcomes: step time, p99 latency, utilization, and packet loss or ECN marks during synchronized phases. It can accept an “uglier” answer—slightly higher oversubscription here, more path diversity there—if it lowers the probability that a few recurring hot spots dominate runtime.
The gains often come from trade-offs people avoid because they’re hard to reason about without a model: different routing policies by traffic class, non-uniform link allocation across tiers, or placement rules that keep all-to-all groups within fewer hops while pushing bulk I/O elsewhere. It will also surface when spending money is the wrong fix, like when a small change in shard placement reduces congestion more than another switch.
The search needs a faithful workload description and a fast evaluator. Building good traffic models, collecting traces, and validating simulator predictions against a real cluster takes time, and the first “optimal” design can be brittle if your job mix shifts month to month.
Data and tooling you need before you can automate
Most teams already have the raw signals needed, but they’re scattered. You need a workload profile that describes communication, not just FLOPs: which collectives dominate (all-reduce vs all-to-all), typical message sizes, synchronization frequency, and how those patterns change with parallelism settings. Pair that with objective metrics you can measure today—step time distribution, p95/p99 service latency, ECN marks/packet drops, and per-link utilization during the “spiky” phases—so the optimizer isn’t chasing a proxy you can’t validate.
On the tooling side, you need three layers: telemetry to capture traces (NCCL/collective timing, switch/NIC counters, queue depth), an evaluator (a simulator or analytic model calibrated against a small set of real runs), and a constrained search loop that can express hard limits like switch radix, cable counts, rack power, and upgrade budget. The practical difficulty is data hygiene: traces vary by software version, placement, and background traffic, so you’ll spend real effort making runs comparable and keeping the model current as workloads evolve.
Rolling it out safely: steps, risks, and success metrics
A safe rollout looks like a pilot with tight blast radius: pick one representative training job and one latency-sensitive inference service, freeze software versions, and capture a “before” week of step-time variance, p95/p99 latency, and congestion signals (ECN marks/drops, queue depth, per-link utilization during collectives). Apply the automation’s recommended topology/routing/placement changes behind a feature flag or a dedicated slice of the fabric, then rerun the same workloads with controlled background traffic.
The main risks are brittle wins that disappear when the job mix shifts, regressions that only show up at scale, and operational costs (more complex routing, harder debugging, stricter change control). Treat success as measurable deltas: lower step-time tail, fewer recurring hot spots, stable p99 under load, and cost-per-token or cost-per-step improvement without raising incident rate.